R2V: WHY AND HOW?
Difference Between Raster and Vector Images
By Yecheng (Ted) Wu, Ph.D., Able Software LLC.
Raster and vector are the two basic data structures for storing and manipulating images and graphics data on a computer. All of the major GIS (Geographic Information Systems) and CAD (Computer Aided Design) software packages available today are primarily based on one of the two structures, either raster based or vector based, while they have some extended functions to support other data structures.
Raster Data
Raster image comes in the form of individual pixels, and each spatial location or resolution element has a pixel associated where the pixel value indicates the attribute, such as color, elevation, or an ID number.
Raster image is normally acquired by optical scanner, digital CCD camera and other raster imaging devices. Its spatial resolution is determined by the resolution of the acquisition device and the quality of the original data source. Because a raster image has to have pixels for all spatial locations, it is strictly limited by how big a spatial area it can represent. When increasing the spatial resolution by 2 times, the total size of a two-dimensional raster image will increase by 4 times because the number of pixels is doubled in both X and Y dimensions. Same is true when a larger area is to be covered when using same spatial resolution.
Vector Data
Vector data comes in the form of points and lines that are geometrically and mathematically associated. Points are stored using the coordinates, for example, a two-dimensional point is stored as (x, y). Lines are stored as a series of point pairs, where each pair represents a straight line segment, for example, (x1, y1) and (x2, y2) indicating a line from (x1, y1) to (x2, y2).
In general, vector data structure produces smaller file size than raster image because a raster image needs space for all pixels while only point coordinates are stored in vector representation. This is even more true in the case when the graphics or images have large homogenous regions and the boundaries and shapes are the primary interest.
When geometric shapes need to be represented precisely in a GIS or CAD system, vector data structure is always option to use because it is not limited to spatial resolution or pixel size and mathematical formulae can be used for regular shapes and smooth curves. In addition, polygon topology is another important issue when implementing a GIS system. Vector data structure provides an easy description for the regions on the left side or right side of a common boundary or if a point is in or out of a polygon area.
Flexible Data Manipulation
Another advantage vector data structure has over raster image is the flexibility of resizing without losing resolution. For example, graphical features such as rivers and roads in a map viewed with a real-world projection system can be easily displayed at any scale without physically changing the data. By contrast, raster image has to be stretched and distorted when scaled above its native resolution.
Besides the above issues, vector data is easier than raster data to handle on a computer because it has fewer data items and it is more flexible to be adjusted for different scale, for example, a specific projection system in a GIS database. This makes vector data structure the apparent choice for most mapping, GIS (Geographic Information System) and CAD (Computer Aided Design) software packages.
Why Is Raster to Vector Conversion Needed?
When vector data is not readily available for setting up a GIS database, the vector data is normally created from existing paper maps or natural source images, such as aerial photos or satellite imagery. Because of its abstract form, vector data has traditionally been acquired using manual tracing with a digitizing tablet from paper maps or base images. The disadvantages of the manual method are slowness and lack of accuracy because human hand is capable of resolution only to the level of 40 dots per inch (DPI). For a typical contour map, it can take one skilled operator 1 or more weeks to trace all the lines manually. The intensive labor requirement makes large mapping and GIS project difficult and expensive to implement.
With the development of scanning technology, image scanners have become cost-effective and capable of high resolution, in the range of 100 – 1,200 DPI. Moreover, similar developments in automated raster to vector conversion have made it possible to take a paper map, scan it and accurately convert it into vector format. This method uses computer to automatically extract vector data from scanned images and eliminates the manual tracing process. Using raster to vector conversion technology, large scale map digitizing or GIS database creation project can now be accomplished in a much shorter time with less demand on human resources.
How Raster to Vector Conversion Is Done?
While vector data structure provides a simpler and more abstract data representation than raster image, an automatic conversion from raster to vector, or so called vectorization process, is not a very easy task, although the opposite direction (from vector to raster) is quite trivial and straightforward. There have been extensive research efforts focused on the issues involved in raster to vector conversion during the past decades.
A complete raster to vector conversion process includes image acquisition, pre-processing, line tracing, text extraction (OCR), shape recognition, topology creation and attribute assignment.
The image acquisition process generates the initial raster image at a certain spatial resolution. The quality and resolution of the raster image are key factors for the quality and accuracy of the vectorized data. It is always recommended to start with clean and sharp originals and scan at a reasonable resolution.
Setting Scanning Resolution
The scanning resolution should match the resolution at which the original image source was created. If scanning resolution is set too high than the original image source, it not only uses unnecessary amount of system resource to process, but also noise and artifact are scanned or generated. This is the same case as looking at a low resolution hardcopy map through using a large magnify glass, rough edges, dots and even paper texture are visible. If you scan a paper map using very high scanning resolution and see a lot of noise in the scanned image, especially when using a color scanner, lowering the scanning resolution may improve the quality. However, if lines are toughing each other in the scanned image, then it indicates the scanning resolution is too low.
Most good quality black and white maps and engineering drawing, including color map separates, can be scanned as 1-bit monochrome. For maps with dirty and smearing background, they can be scanned as 8-bit greyscale and enhanced using imaging software to remove background and noise.
Although color scanners have come a long way, large format and high resolution scanning is still quite expensive. Other color images, such as satellite and aerial photos, have been used directly to create vector data, such as region boundaries, street and road lines. Because of more bits (normally 24-bit) are used, color image files are normally bigger and require more system resource to store and process.
Preprocessing Steps
Preprocessing steps are different depending on the image type. For 1-bit monochrome image, de-speckle is often used to remove noise and smooth rough edges. For 8-bit greyscale image, thresholding and background removal are processing steps to improve image quality for vectorization. For color images, they are often classified to separate the colors so each color can be vectorized into a separate vector layer.
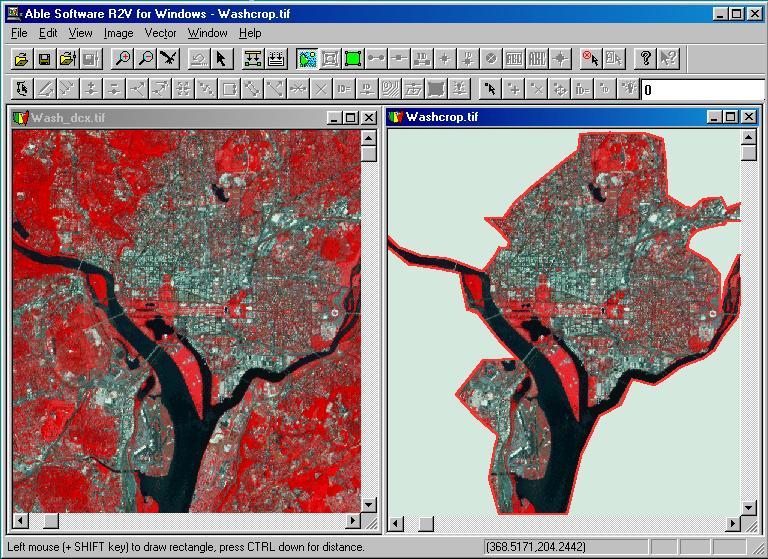
Defining regions of interest (ROI) for vectorization or image cropping is another often used preprocessing step to limit the processing only in the areas interested. It is important to allow the use of polygons and group of polygons to include cases such as islands, holes, rings and other shapes.
Figure 1 shows regions of interest defined for the SPOT image (Washington DC, USA) and image cropped to indicate the regions of to be processed.
Mosaicing
Image mosaic or stitching is normally done when a source map is larger than the scanner can handle. In this case, the map is scanned into sub-sections and then merged into a whole image for raster to vector conversion. This is often done as a post-processing step by merging the vector data sets after each section is vectorized. Merging vector data instead of raster image certain has its advantages, because vector data takes much less computer memory and can be processed faster while image stitching can create huge size images that are beyond the processing capability of a regular PC.
Vectorization
The line tracing process extracts two types of lines: center line and boundary line. The center line method tracks the center pixel within a raster line and follow to the line until it reaches an intersection or the end of the line. The boundary line method tracks the boundary pixels of a color region to get closed polygons.
Although there have been many methods developed for line tracing, they can be divided into two groups: line thinning and line following. The line thinning method is more of a global approach, which iterates through the entire image in multiple passes and eliminates boundary pixels during each iteration until only the skeleton pixels are left. The line following method uses computer intelligence to analyze line shapes, thickness and intersections to follow the line centers. This method is frequently employed in semi-automatic interactive tracing while line thinning based methods are used for fully automatic conversion of complex images.
After lines are extracted, they are labeled with line attributes or elevations if contours. Closed polygons can be generated from line segments if needed. Control points are defined and applied to geo-reference the vector data to a target projection system.
Figure 2 shows a color topo map is classified and vectorized. The generated vector data is displayed in the window on the right. 3D elevation model is created from the vector contours and displayed in the upper right window.
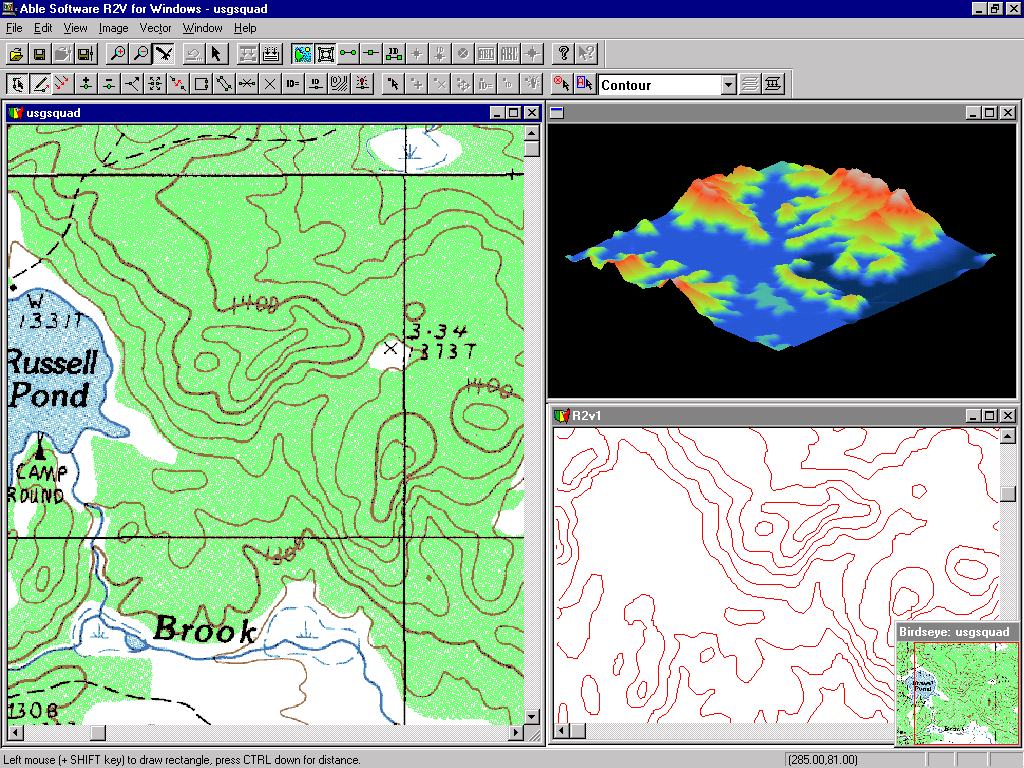
Figure 3 shows that closed polygons are created from vectorized line segments.
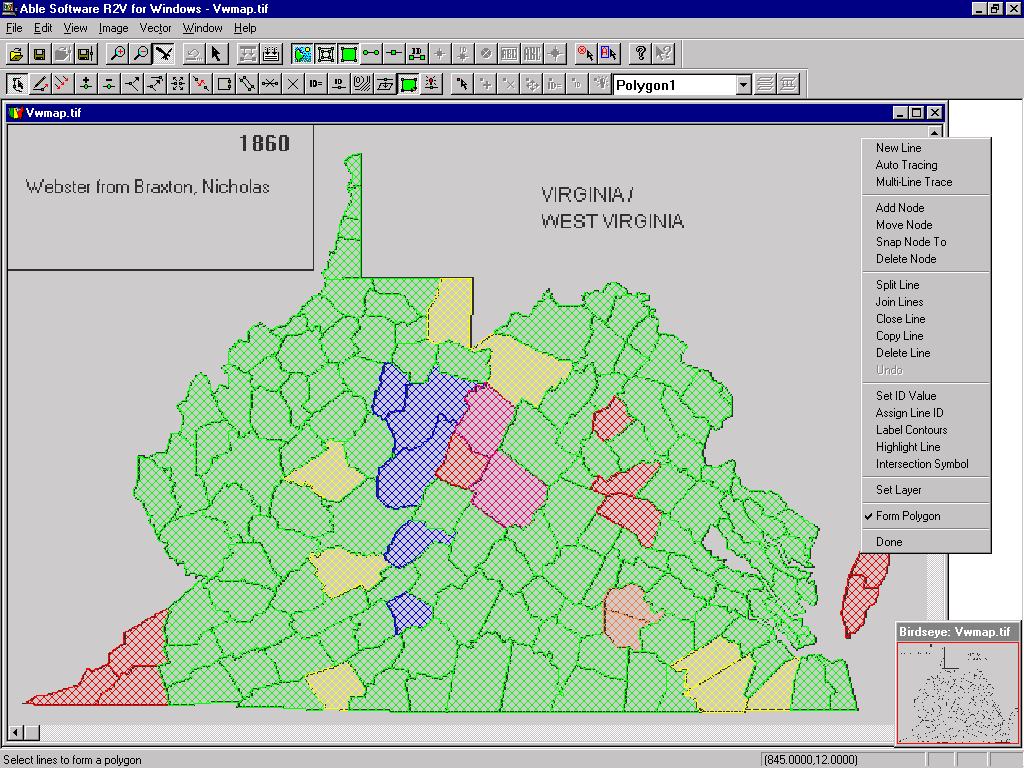
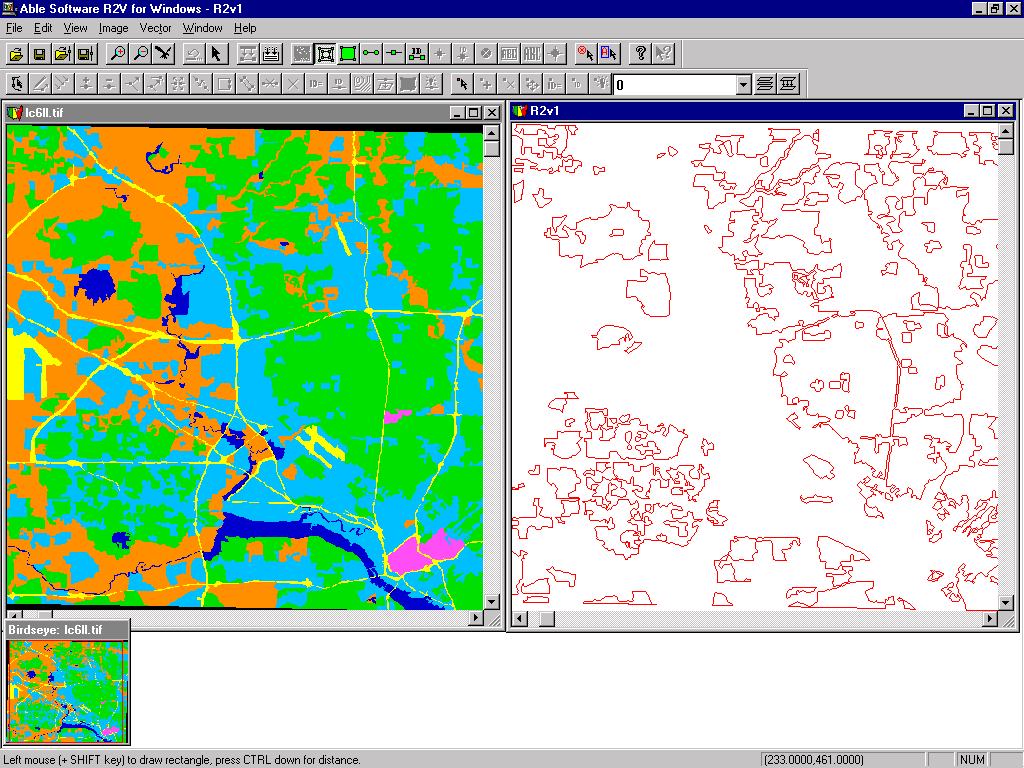
Figure 4 shows that boundary lines are traced directly from a classified SPOT image. Different color regions are traced and put into separate map layers.
Several raster to vector conversion software packages are commercially available for different applications, such as engineering drawing conversion, map digitizing and GIS data capture. The R2V software developed by Able Software LLC. (www.ablesw.com) in 1993 has a focus on vectorization of scanned maps and GIS data creation.
Choosing The Right Conversion Tool
There are quite a few commercial packages available for raster to vector conversion. Below are few questions one should ask when selecting the right tool for the task:
1. Does it support different image types, such as 1-bit black/white, greyscale and 24-bit RGB color?
This is quite important for people whose source images are in color. Treating color images as black and white or greyscale apparently loses all color information and a significant amount of editing may be needed to separate colors by hand.
2. Is it designed for maps or engineering drawings?
In practice, the handling of map data and engineering data are quite different although they both are vector based. If a package is designed for CAD drawings, the algorithms normally works well for straight lines and regular geometric shapes and will not be efficient for curving lines, polygons and topology between polygons. Geo-referencing is another crucial factor for maps and GIS database while it is normally not a concern for CAD applications.
3. Does it support the native format for your application?
It’s unfortunate that most vector file formats used today are different and data exchange between two formats can easily result some data loss. One format may be excellent for CAD data transfer, but very limited if you need to get data into a GIS or mapping database. When creating vector data, it is always better to use the native format the target system supports.
4. Image processing functions
The quality of raster to vector conversion depends largely on the quality of the source image that is affected by many factors, including scanner, cleanness and age of the source map, scanning resolution, color or black/white, and others. Without necessary image processing functions, such as remove background for old maps with blue background, color separation for color maps, define polygon-based region of interest (ROI), image rubber sheeting to correct distortion, the usefulness of the final vector product may be quite limited.
References
Y. Wu, "Raster, Vector, and Automated Raster-to-Vector Conversion", in "Moving Theory into Practice: Digital Imaging for Libraries and Archives", book eds. by Anne R. Kinney and Oya Y. Rieger, 2000, RLG, Cornell Univ. Library
L.R. Poos and Y. Wu, "Digitizing History: GIS and Historical Research", GIS World, July 1995, pp. 48-51
J.R. Parker, "Algorithms for Image Processing and Computer Vision", 1997, John Wiley & Sons.