3D Terrain Modeling With R2V
New 3-D printers can create realistic terrain models for better visualizations
and presentations.
By Y. Ted Wu and Mark Kemper
Wu is president/CEO
of Able Software LLC.;
e-mail: ywu@ablesw.com. Kemper is president,
Engineering & Manufacturing Services Inc.;
e-mail: mark.kemper@ems-usa.com.
We can look at 3-D models from different viewing angles as well as rotate, zoom in and out, fly through and manipulate them. However, the thousand-year-old challenge remains, because what we see is just a snapshot of the 3-D models projected to a 2-D computer screen. How can we go a step further to see the objects in true 3-D space? Thanks to recent technological developments, we can create realistic 3-D terrain models from scanned contour maps and other data sources.
Raster to Vector
A contour or topographic map first is scanned, and the image is saved in a raster image file format such as TIFF or JPEG. A raster image comes in the form of individual pixels, and each spatial location or resolution element has a pixel with a color value. Although contour lines in a raster image have their own color that's different from the background and other map attributes, 3-D information isn't readily available for creating a 3-D model. This requires translating the raster image to a vector format in which contour lines are extracted and labeled by their elevation values. Able Software's R2V product ( http://www.ablesw.com/r2v ), for example, can be used to automate the conversion process, which involves an automatic "vectorization" of the raster image, contour labeling and geo-referencing. The vector data then can be saved to many standard GIS formats, including ESRI's ArcView Shapefile, ArcInfo generate file, MapInfo's MIF/MID file and AutoCAD's DXF format.
Creating 3-D DEMs
Creating 3-D digital elevation
models (DEMs) from vectorized contour lines is an automatic, but
computer-intensive, process. An interpolation algorithm is used to fill the
space with elevation values using contours. 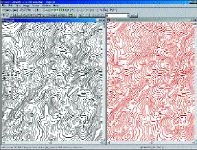
Figure 1. A scanned contour map is stored as a TIFF file in the left window. The map was scanned as a one-bit monochrome image at 400 dots per inch. The right window shows the vectorized and labeled contours using Able Software's R2V product
Natural source images, such as satellite imagery and aerial photos, provide rich graphical information about Earth's surface. By draping a satellite image on a 3-D terrain model, we can create a realistic 3-D model with elevation and surface texture.
First, the image region that covers the exact geographic area is defined and draped onto the surface of the terrain model. Then other images, even the original scanned map, can be used as the surface image to create a certain display effect. The 3-D display can be visualized and animated by changing the viewing angle and can be saved to a 3-D file using formats such as VRML, DXF, U.S. Geological Survey DEM and ASCII grid.
The Real Thing
The first use of 3-D printing
technology was for rapid prototyping applications in computer-aided design (CAD)
and manufacturing. It takes digital models of objects designed using CAD
software and creates prototypes that can be passed around the room. This is a
perfect tool for GIS applications to get hard-copy 3-D output of various 3-D
models. 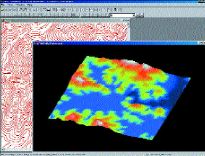
Figure 2. A 3-D DEM created from vectorized contour lines demonstrates a color palette that indicates elevation levels. Dark blue indicates low elevations, and red and yellow indicate higher elevations.
How does it work? As an example,
we'll discuss Z Corp.'s Z406 3-D printer ( http://www.zcorp.com
), which we used to produce the models shown in this article. The printer's
software digitally slices a 3-D model into hundreds of cross sections. It then
prints each section using starch- or plaster-based powder and a binding
chemical, piling the layers atop one another until the object takes shape.
Powder also is laid down around the model to support it. But because it's not
chemically treated, it falls away and can be recycled. A full-color, 3-D model
of eight by 10 by two inches can be produced in two hours for a price less than
$50. 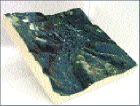
Figure 3. A satellite image was draped on a 3-D terrain model using Able Software's R2V package.
Although the process seems to be tedious and time consuming, it's fully automatic and similar to how we print using a regular inkjet or laser printer. All it needs is the 3-D file stored in a supported format. The 3-D models generated by R2V are saved to the Virtual Reality Modeling Language (VRML) format that supports surface texture images and is portable via the Internet. There are many free plug- ins available to download and view VRML files within a World Wide Web browser.
This not only gives respect to the large amount of time given freely by
the developers but also helps build interest, trrtaffic and use of our
free and paid designs. If you cannot (for good reas
on) retain the full copyright we request you at least leave
in place the Website Templates line, with Website Templates linked to
www.metamorphozis.com. If you refuse to include even this then support
may be affected.
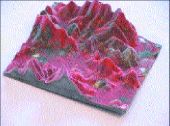
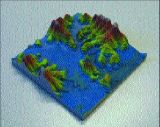
Figure 4. Additional 3-D models are shown without a surface image (left) and with a satellite image draped on the surface (right).
This is just the beginning.
Eventually, 3-D GIS and visualization will be used as casually as we now use 2-D
map- ping and GIS programs. There are still limitations in 3-D output, however,
including the output size. This can be overcome by dividing a model into small
sections for 3-D printing and then putting them together to form a larger model.
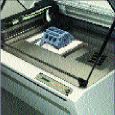
Figure 5. Z Corp.'s Z406 3-D printer digitally slices a 3-D model into hundreds of cross sections and prints each section using starch- or plaster-based powder and a binding chemical, piling the layers atop one another until the object takes shape.
Obviously 3-D data on a computer screen really is flat 2-D data in an isometric view. You can't touch it, feel it or grasp the information like a physical model. If you place a physical color GIS model next to a computer monitor with the same data on the computer screen, most people gravitate to the model. This new printing technology provides a relatively easy and cost-effective means to create such models. Soon a 3-D printer will sit beside many inkjet printers to let geotechnology users produce 3-D output on demand.