RASTER, VECTOR AND AUTOMATED MAP DIGITIZING
Yecheng (Ted) Wu, Ph.D., (ywu@ablesw.com) Able Software LLC. (http://www.ablesw.com)
Copyright © 1999, All rights reserved.
Difference Between Raster and Vector Images
Raster and vector are the two basic data structures for storing and manipulating images and graphics data on a computer. All of the major GIS (Geographic Information Systems) and CAD (Computer Aided Design) software packages available today are primarily based on one of the two structures, either raster based or vector based, while they have some extended functions to support other data structures.
Raster image comes in the form of individual pixels, and each spatial location or resolution element has a pixel associated where the pixel value indicates the attribute, such as color, elevation, or an ID number.
Raster image is normally acquired by optical scanner, digital CCD camera and other raster imaging devices. Its spatial resolution is determined by the resolution of the acquisition device and the quality of the original data source. Because a raster image has to have pixels for all spatial locations, it is strictly limited by how big a spatial area it can represent. When increasing the spatial resolution by 2 times, the total size of a two-dimensional raster image will increase by 4 times because the number of pixels is doubled in both X and Y dimensions. Same is true when a larger area is to be covered when using same spatial resolution.
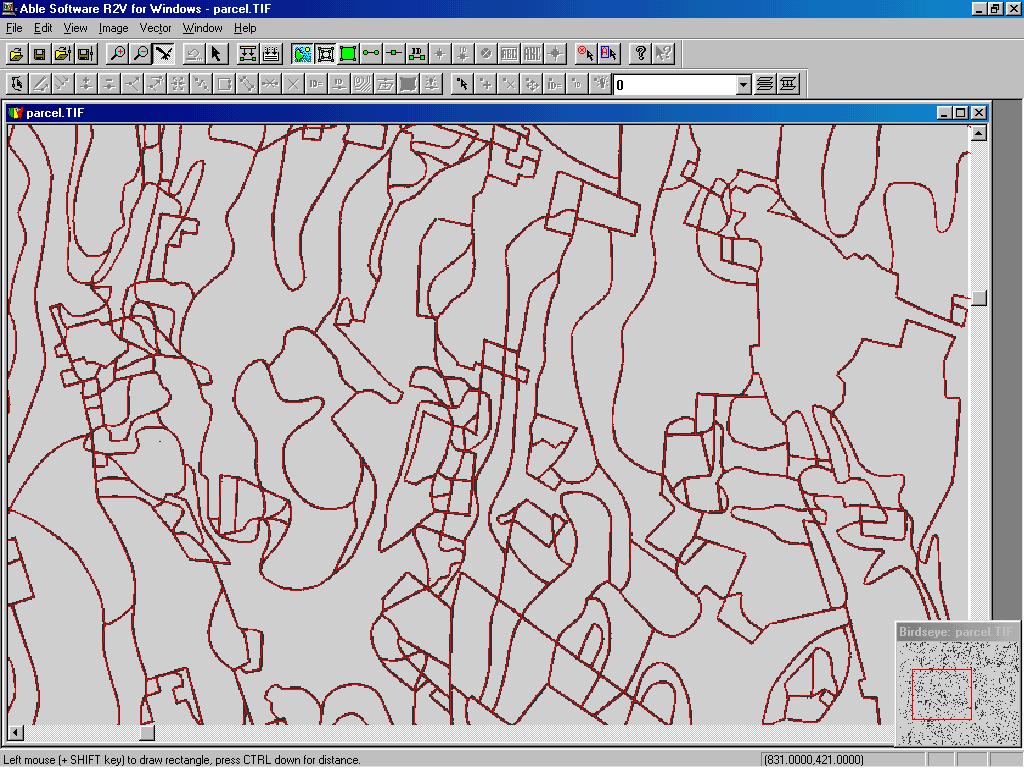
Vector data comes in the form of points and lines, that are geometrically and mathematically associated. Points are stored using the coordinates, for example, a two-dimensional point is stored as (x, y). Lines are stored as a series of point pairs, where each pair represents a straight line segment, for example, (x1, y1) and (x2, y2) indicating a line from (x1, y1) to (x2, y2).
In general, vector data structure produces smaller file size than raster image because a raster image needs space for all pixels while only point coordinates are stored in vector representation. This is even more true in the case when the graphics or images have large homogenous regions and the boundaries and shapes are the primary interest. Besides the size issue, vector data is easier than raster data to handle on a computer because it has fewer data items and it is more flexible to be adjusted for different scale, for example, a projection system in mapping application. This makes vector data structure the apparent choice for most mapping, GIS (Geographic Information System) and CAD (Computer Aided Design) software packages.
Also, topology among graphical objects or items are much easier to be represented using vector form, since a commonly shared edge can be easily defined according to its left and right side polygons. On the other hand, this is almost impossible or very difficult to do with pixels.
Digitizing Vector
Although vector data structure is the choice as the primary form for handling graphical data in most GIS and CAD packages, vector data acquisition is often more difficult than raster image acquisition, because its abstract data structure, topology between objects and attributes associated.
In the following, we explain the commonly used methods for getting vector data, their advantages and drawbacks.
- Manual digitizing
Manual digitizing using a digitizing tablet has been widely used. With this method, the operator manually traces all the lines from his hardcopy map using a pointer device and create an identical digital map on his computer. A line is digitized by collecting a series of points along the line.
Although this method is straight forward, it requires experienced operator and is very time consuming. For a complex contour map, it can take a person 10 to 20 days to get the map fully digitized.
Another major drawback of this method is its low accuracy. The accuracy of manual digitizing merely depends on how accurate the hardcopy map is duplicated on a computer by hand. The spatial accuracy level the human hand can resolve is about 40 DPI (dots per inch) in the best case and will be lower while the operator is tired and bored after working on it for a period of time. One experiment was done at a university, a group of geography students were asked to digitize the same map and the final digitized maps were overlaid on top of each other to create a new map. The result is not surprising, the new map is heavily distorted as compared to the original map.
Manual digitizing is supported by most GIS packages with direct link to a digitizing tablets through a computer I/O port.
- Heads-Up Digitizing and Interactive Tracing
Heads-up digitizing is similar to manual digitizing in the way the lines have to be traced by hand, but it works directly on the computer screen using the scanned raster image as backdrop. While lines are still manually traced, the accuracy level is higher than using digitizing tablet because the raster images are scanned at high resolution, normally from 200 DPI to 1600 DPI. With the help of the display tools, such as zoom in and out, the operator can actually work with the resolution of the raster data therefore digitize at a higher accuracy level. However, the accuracy level is still not guaranteed because it is highly dependent on the operator and how he digitizes. This method is also time-consuming and takes about same amount of time as the manual digitizing method.
The interactive tracing method automates individual line tracing process by tracing one line at a time under the guidance of the operator. This is a significant improvement over manual heads-up digitizing in terms of digitizing accuracy and speed, especially when fully automatic raster to vector conversion can not be applied in cases such as low image quality and complex layers. The main advantage of using interactive tracing is the flexibility of tracing lines selectively and better operator control.
- Automatic Raster to Vector Conversion
Automatic digitizing or so called automated raster to vector conversion, traces lines automatically from the scanned raster image using image processing and pattern recognition techniques. The idea behind automated raster to vector conversion algorithm is to let the computer do the actual line tracing and eliminate tedious manual tracing the human operator has to do.
Because of the importance to automate raster to vector conversion process and the difficulties involved, it has been a major research focus during the past two decades. Only in recent years, automated raster to vector conversion software on PCs and small computers become practical and commercially available for data acquisition applications.
Challenges in Doing Raster to Vector Conversion
While vector data structure provides a simpler and more abstract data representation than raster image, it is not easy to do an automatic conversion from raster to vector, or so called vectorization process, although the opposite direction (from vector to raster) is quite trivial. There have been extensive research efforts focused on the issued involved in raster to vector conversion during the past decades.
A complete raster to vector conversion process includes image acquisition, pre-processing, line tracing, text extraction (OCR), shape recognition, topology creation and attribute assignment.
The image acquisition process generates the initial raster image at a certain spatial resolution. The quality and resolution of the raster image are key factors for the quality and accuracy of the vectorized data. It is always recommended to start with clean and sharp originals and scan at reasonable resolution. The scanning resolution should match the resolution at which the original image source was created. If scanning resolution is set too high than the original image source, it not only uses unnecessary amount of system resource to process, but also noise and artifact are scanned.
For most good quality black and white maps and engineering drawing, such as color map separates, can be scanned as 1-bit monochrome. For maps with dirty and smearing background, they can be scanned as 8-bit greyscale and enhanced using imaging software to remove background and noise.
Although color scanners have come a long way, large format and high resolution scanning is still quite expensive. Color classification and color separation are very sensitive to the color quality of the scanned image. Other color images, such as satellite and aerial photos, have been used directly to create vector data, such as region boundaries, street and road lines. Because of more bits (normally 24-bit) are used, color image files are normally bigger and requires more system resource to store and process.
Recent developments in automated raster to vector conversion technology have made it possible to take a hardcopy image, scan it and convert it into vector format in a matter of minutes or even seconds. With manual method using a digitizing tablet, this process can take days or weeks to complete because all lines have to be traced by hand.
Several raster to vector conversion software packages are commercially available for various types of applications, such as engineering drawing conversion, map digitizing and GIS data capture. The R2V software was developed by Able Software LLC (www.ablesw.com) and available since 1993 with a focus on vectorization of scanned maps and GIS data creation. R2V is currently being used in more than 60 countries for map digitizing and GIS data capture applications.
Choosing The Right Conversion Tool
There are quite a few commercial packages available for raster to vector conversion. Below are few questions one should ask when selecting the right tool for the task:
1. Does it support different image types, such as 1-bit black/white, greyscale and 24-bit RGB color?
This is quite important for people whose source images are in color. Treating color images as black and white or greyscale apparently loses all color information and a significant amount of editing may be needed to separate colors by hand.
By starting directly with a color image, one can use color classification or separation functions to separate colors into layers and vectorize layers.
2. Is it designed for maps or engineering drawings?
In practice, the handling of map data and engineering data are quite different although they both are vector based. If a package is designed for CAD drawings, the algorithms normally works well for straight lines and regular geometric shapes and will not be efficient for curving lines, polygons and topology between polygons.
Attribute labeling is another issue here. GIS and mapping data requires extensive attribute labeling to link graphical items to database, while CAD drawing are mostly shape and geometry oriented and spatial analysis is hardly done.
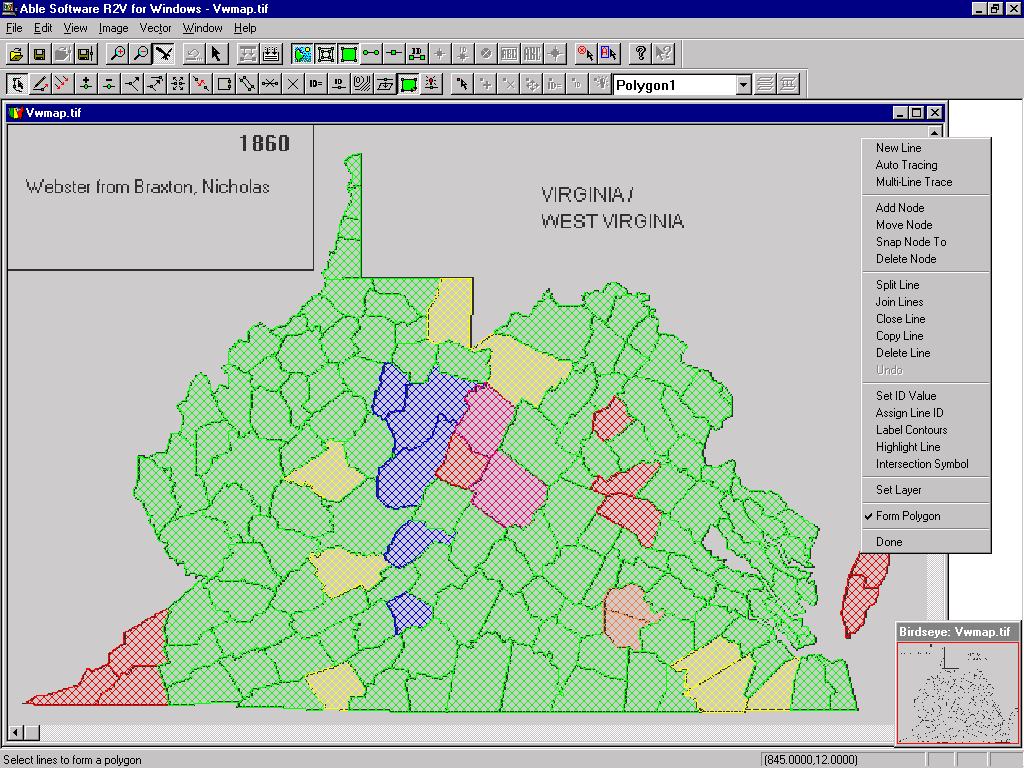
Other specialized functions, such as geo-referencing, contour labeling and polygon creation are critical for mapping and GIS while they are not concerned when creating a CAD drawing.
3. Does it support the native format for your application?
It’s unfortunate that most vector file formats used today are different and data exchange between two formats may result some data loss. One format may be excellent for CAD data transfer, but very limited if you need to get data into a GIS or mapping database. When creating vector data, it is always better to use the native format the target system supports.
4. What methods of raster to vector conversion does a package support?
As discussed previously, there are advantages and drawbacks for methods using fully automatic conversion or interactive tracking. A good package should support all methods, including fully automatic vectorization, interactive tracing and easy-to-use heads up digitizing, in order to handle a wide variety of maps and drawings.
5. How Good Is The Editing Functions?
Does it provide editing functions for both vector data or raster image? How easy can it be used for complex mapping or GIS data sets?
Raster image editing and preprocessing are important to clean up the original scanned image when it's impossible to do anything to the original hard copy source. Image sources vary greatly, in terms of age, quality, and scanning device used, you will need raster image editing functions sometime.
A powerful grayscale image background removal function, such as the one provided by R2V, is essential to remove dirty or dark background when images are scanned from old maps or blue prints.
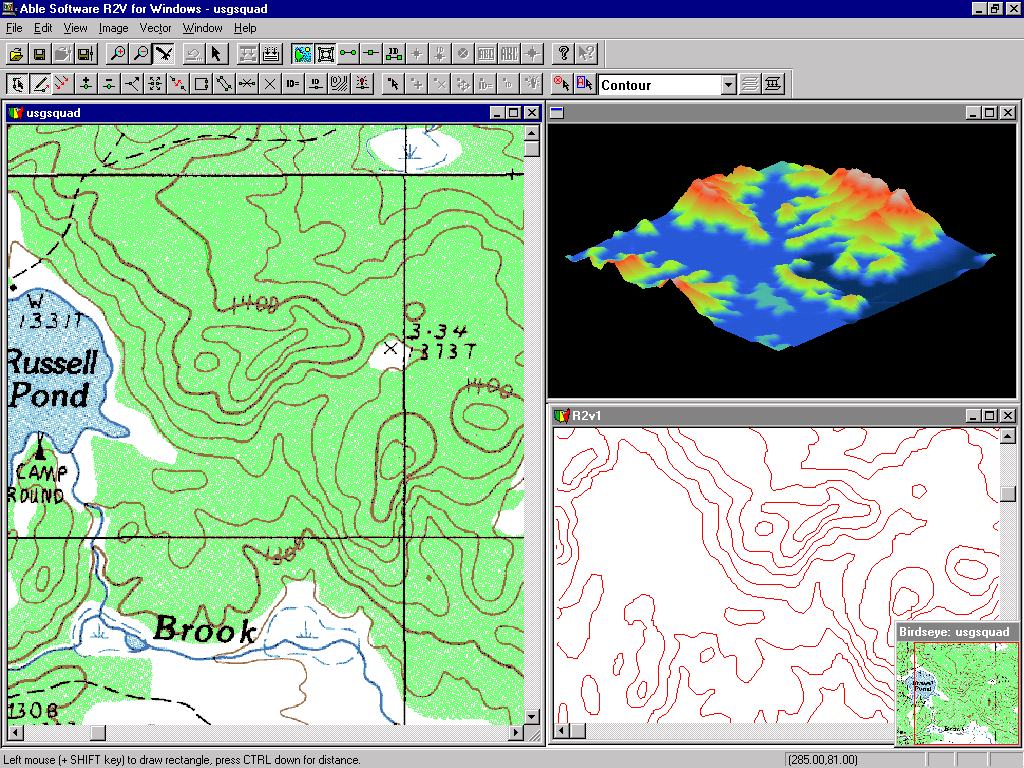
6. Specialized tools, such as 3D DEM (digital terrain model) creation and display, are very important when digitizing a topo map. When all contour lines are vectorized and labeled, how can you verify if the data is correct? Displaying the data in 3D makes it easier to spot errors and correct them.
References:
Y. Wu, "Raster, Vector, and Automated Raster-to-Vector Conversion", in Moving Theory into Practice: Digital Imaging for Libraries and Archives, Book Eds. by A.R. Kenney and O.Y. Rieger, 2000, Research Libraries Group
Y. Wu, "Automated Creation of DEM from Contour Maps: Developments in Raster to Vector Conversion Technology", 1996 NEARC Conference, Saratoga Spring, NY
L.R. Poos and Y. Wu, "Digitizing History: GIS and History Study", GIS World, 48-51, July, 1995